
A team of US scientists has managed to formulate the first complete global geologic map of Io, the innermost of Jupiter’s largest moons.
The map, published by the US Geological Survey with the help of Arizona State University (ASU), depicts the characteristics and relative ages of some of the most geologically unique and active volcanoes and lava flows ever documented in the Solar System.
Following its discovery by Galileo in January 1610, Io has been the focus of repeated telescopic and satellite scientific observation.
Studies indicated that the orbital and gravitational relationships between Io, its sister moons Europa and Ganymede, and Jupiter cause massive, rapid flexing of its rocky crust.
These tidal flexures generate tremendous heat within Io’s interior, which is released through the many surface volcanoes observed.
“One of the reasons for making this map was to create a tool for continuing scientific studies of Io, and a tool for target planning of Io observations on future missions to the Jupiter system,” explained David Williams of ASU.
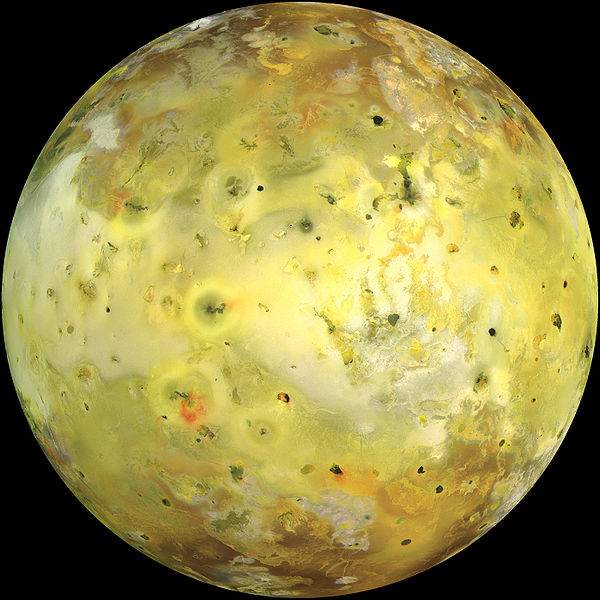
Indeed, the highly detailed, colorful map depicts a number of volcanic features, including: paterae (caldera-like depressions), lava flow fields, tholi (volcanic domes), and plume deposits, in various shapes, sizes and colors, as well as high mountains and large expanses of sulfur- and sulfur dioxide-rich plains. The mapping also identified 425 paterae, or individual volcanic centers.
However, says Williams, one feature you will not see on the geologic map is impact craters.
“Io has no impact craters; it is the only object in the Solar System where we have not seen any impact craters, testifying to Io’s very active volcanic resurfacing.”
To be sure, Io is extremely active, with literally hundreds of volcanic sources on its surface. Athough Io is so volcanically active (more than 25 times more volcanically active than Earth), most of the long-term surface changes resulting from volcanism are restricted to less than 15 percent of the surface, mostly in the form of changes in lava flow fields or within paterae.
“Our mapping has determined that most of the active hot spots occur in paterae, which cover less than 3 percent of Io’s surface,” Williams noted.
“Lava flow fields cover approximately 28 percent of the surface, but contain only 31 percent of hot spots. Understanding the geographical distribution of these features and hot spots, as identified through this map, are enabling better models of Io’s interior processes to be developed.”
The Io geologic map is unique from other USGS-published planetary geologic maps as its surface features were mapped and characterized using four distinct global image mosaics. These image mosaics, generated by the USGS, combine the best images from NASA’s Voyager 1 and 2 missions (acquired in 1979) as well as the Galileo orbiter (1995-2003).
Using the mosaics from the USGS, Williams mapped the entire surface of Io into 19 different types of surface material types, and determined their locations and sizes (areas). He then correlated the map information with the locations of all known hot spots (locations of active volcanism) to provide a global picture of the styles of volcanism on Io.
“Because of the non-uniform coverage of Io by multiple Voyager and Galileo flybys, including a variety of lighting conditions, it was absolutely necessary to use the different mosaics to identify specific geologic features, such as separating mountains and paterae from plains, and separating the colored plume deposits from the underlying geologic units.
“Because Io is so active, and continues to be studied by Earth-based telescopes, we are doing something different than producing just the paper geologic map. We are also making an online Io database, to include the geologic map, the USGS mosaics, and all useful Galileo spacecraft observations of Io,” he added.